MySQL is considered the most popular relational open source database server used all over the world. The community edition of MySQL, owned by Oracle, is freely available to download along with its commercial edition to support it through its additional features. Initially in 1995 MySQL was released and since then it is competing with various high profile technologies like Percona and MariaDB on the basis of its excellent performance.
Main features of MySQL performance
Your MySQL server will face performance issues if every part of your stack depending upon your database fails to serve queries or runs slowly due to any reason. You can effectively monitor the metrics covering the utilisation of the resource and areas of MySQL performance to keep your database run smoothly. These performance areas may include query throughput, query execution performance, connections and usage of buffer pool.
Monitoring MySQL performance
While MySQL monitoring your main focus should be to monitor the system to ensure that it is working effectively. The work of a database is to run the queries smoothly. So your first priority while monitoring MySQL should be to ensure that the queries are executed by it as per your expectations.
Query throughput
The internal counter of MySQL, known as Questions, grows for all the statements sent by the applications of the client. The views of the client offered by the metrics of the Questions usually makes it easier to interpret as compared to the metrics related to the counter of queries, which also calculates the number of executed statements as part of commands and stored program and run as the part of the statements prepared on server side.
In order to identify potential hindrances and understand the workload of your database you can also monitor the breakdown of writing and reading commands. The rates of queries rise and fall naturally which cannot be used as fixed thresholds for actionable queries. But sudden changes in the volume of query like severe drop in throughput is worthwhile to note as it indicates critical issues.

Performance of query execution
The users of MySQL have a number of options for monitoring underlying performance execution of query including the use of built-in metrics of MySQL and querying their performance through their run-time, errors and speed.

Connections
During the process of MySQL performance monitoring the connections of your client play important role because your client can refuse new connections if you have exhausted the available connections once. The default MySQL connection limit is up to 151, which can be verified through a query.

Monitoring the usage of buffer pool
MySQL counts the connection threads to expose a Threads_connected metric. You can ensure that you have enough capability to handle new connections by monitoring this metric along with the limit of your configured connections. In order to isolate the threads processing the queries actively at a particular time MySQL also exposes the Threads_running metric against the connections that are idle at present but are open.

Methods and tools used for monitoring MySQL performance
Various types of methods and tools can be used for MySQL performance monitoring. Some of the popular methods and tools used by MySQL users for this purpose are briefly discussed here under for your consideration.
MYSQLADMIN: In order to recover a number of metrics you will have to get connected to your MySQL server to run some of the queries. You can use Mysqladmin, included in the package of your MySQL server, as a simple and effective alternative for this purpose. Mysqladmin is a great interactive and real time tool. But while using it to monitor a MySQL server you will have to record metrics. It also helps in alerting, analysis and troubleshooting. When you want to check a metric of your MySQL server then instead of searching for some additional software you can use this option effectively. It can go on helping you in this respect with the help of other tools and methods, even if you want to do more advance monitoring of the MySQL performance.
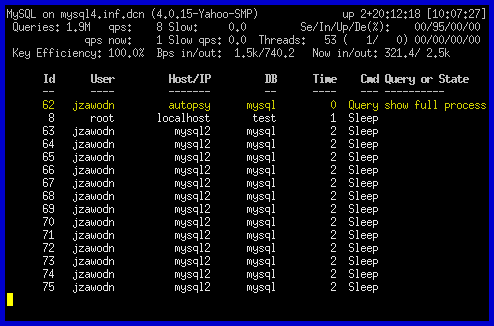
MYTOP: Like the best interface MyTop exposes the statistics about queries, threads, uptime, load time and slow queries of your MySQL server. You can find this MySQL monitoring tool in the repositories of Ubuntu, CentOS, digitalOcean or Debian.

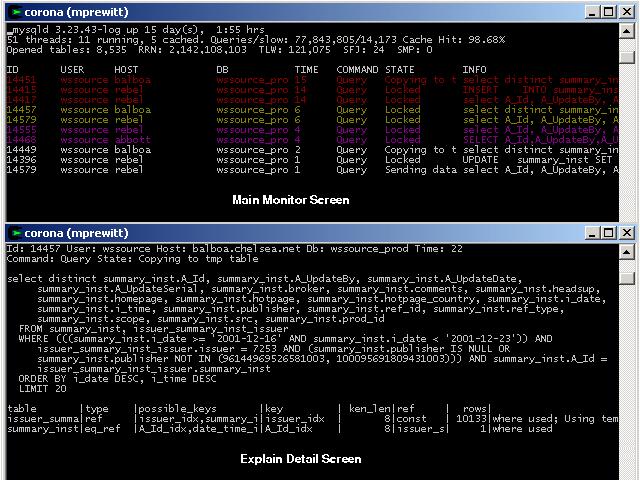
MTOP: It is another MySQL performance monitoring tool which is very much similar to MyTop. But it cannot be maintained actively as it is not officially included in the repositories of most of the MySQL distribution systems.

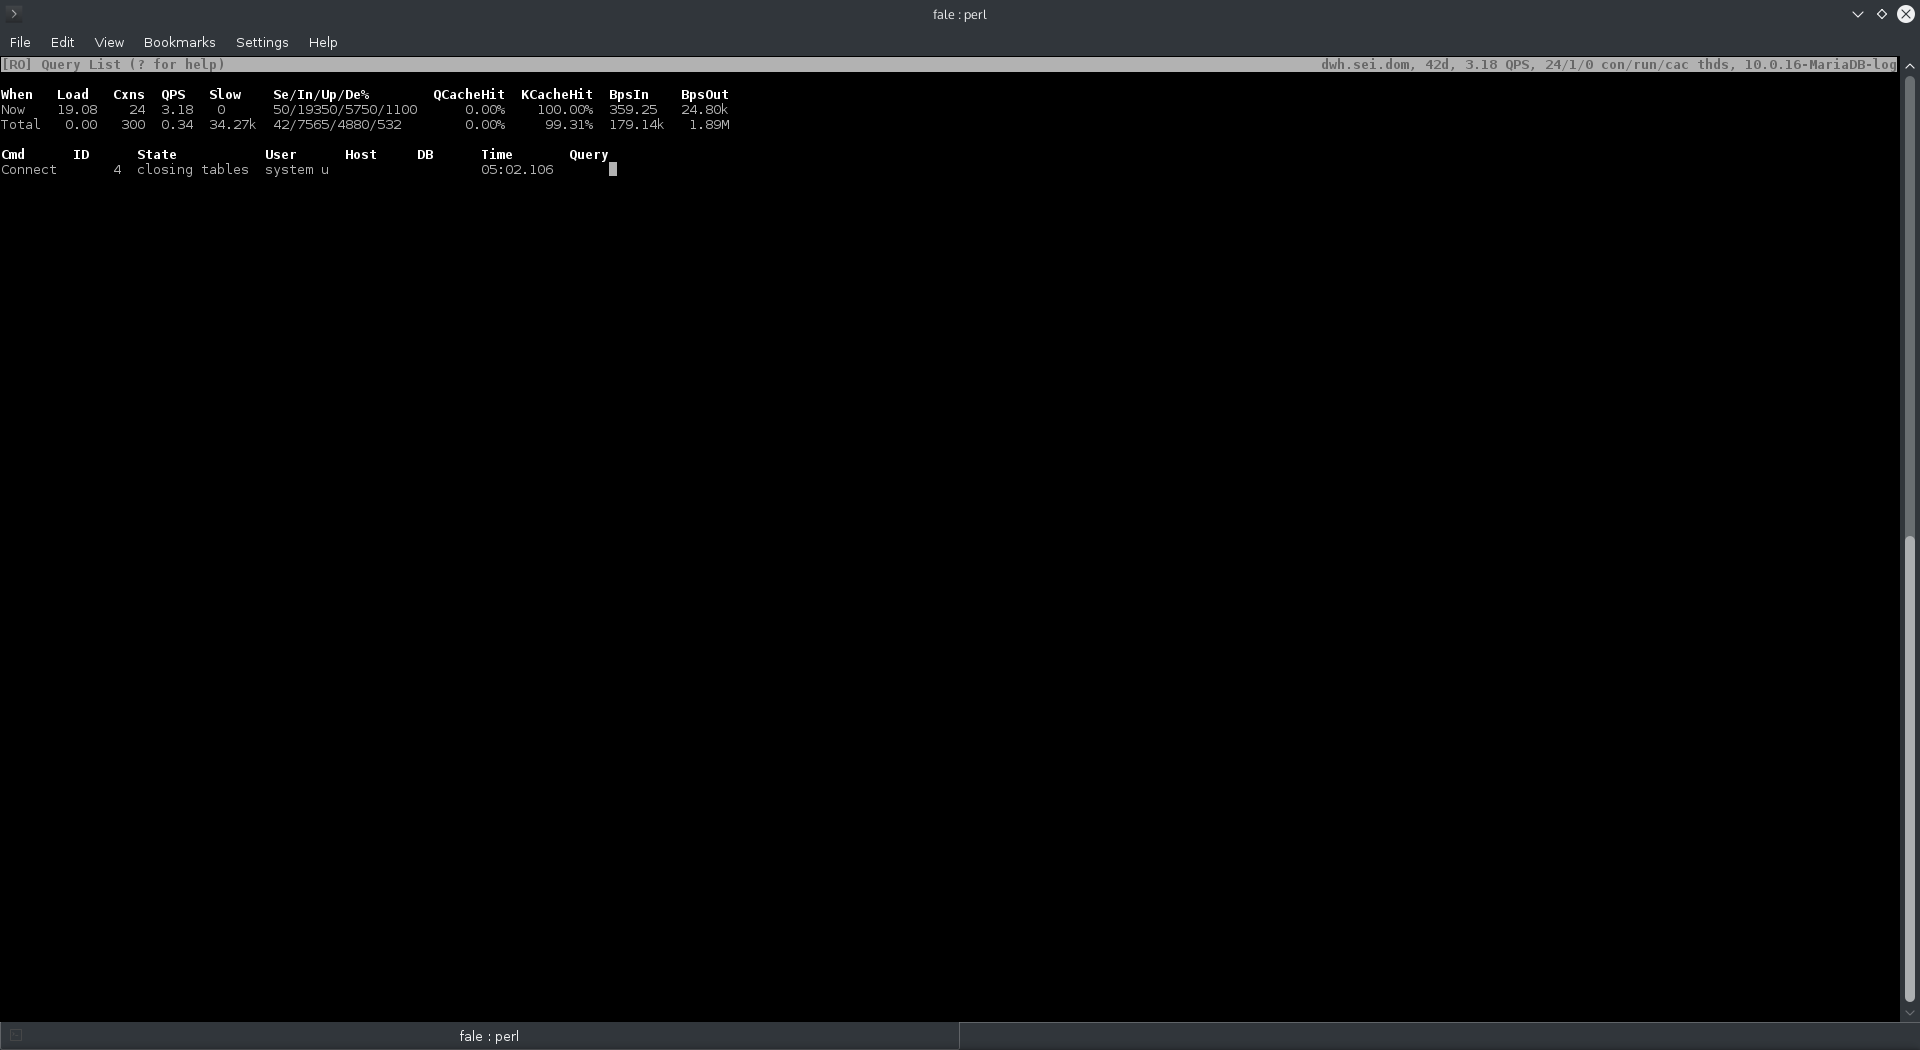
INNOTOP: It is one of the MySQL monitoring tools which are preferred by the users who want to choose only one tool. The reason behind this preference is that it displays everything including buffers, InnoDB I/O, lock tables, open tables and queries etc. The client packages of some of the versions of MySQL also include Inntop. So you need not install them on your server to monitor its performance.

MYSQLREPORT: It is another tool that can help MySQL users in reporting the performance of their server. It can help in easily reading the command of Show Status. It was used as the part of the project of hackmysql.com, which has been retired now. However, it is still included in the client packages of MySQL and used effectively till today. In order to get more details about mysqlreport you can search online.
Percona Monitoring Plugins: It is considered as the most open source solution used for MySQL performance monitoring. It provides alerts and graphics on the presently available monitoring solutions on any premise like Cacti, Zabbix or Nagios. Percona toolkit, developed by Percona is also used as a popular tool for administering database by some of these plugins.
MySQL Performance Schema: You can also try MySQL Performance Schema if you want to understand the performance of your MySQL server more precisely.
Thus MySQL performance monitoring can be done easily and effectively by using the tools and methods discussed in this write-up to ensure that your server is running your database by capturing the metrics discussed above properly.

